
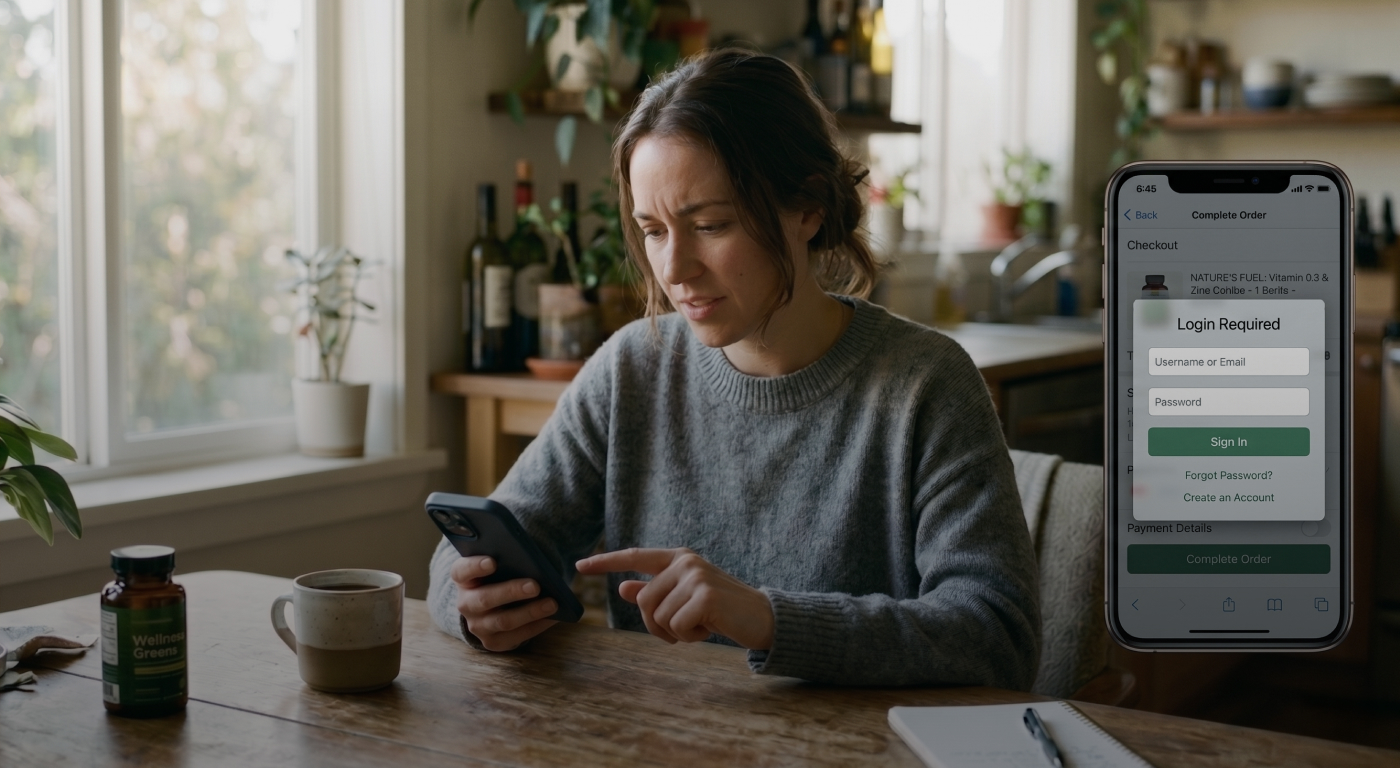

If you only fix one thing in your store this quarter, fix the checkout. Cart abandonment is the single largest source of recoverable revenue in eCommerce, and the gap between stores that recover that revenue and stores that do not is mostly about checkout architecture, not clever marketing.
Baymard Institute estimates roughly $260 billion in abandoned revenue is recoverable in the US and EU alone. The good news for merchants is that the reasons shoppers walk away in 2026 are almost entirely things you control: how prices are shown, how long the checkout takes, what payment methods are available, and how the page behaves on a phone.
What is a normal cart abandonment rate in 2026?
The average cart abandonment rate in 2026 is 70.22 percent, based on a rolling average of 50 studies tracked by Baymard Institute. A healthy range for most categories sits between 60 and 80 percent. Anything above 80 percent suggests a structural problem with checkout, pricing, or payment methods, not bad luck.
The headline average hides the most important number, though. Cart abandonment is now a mobile-first problem:
- Mobile abandonment: 80.02 percent
- Desktop abandonment: 66.41 percent
That gap, roughly 14 percentage points, is where most stores are leaking revenue today. If your mobile traffic share is north of 60 percent (which it almost certainly is), mobile checkout is the first place to look.
Why shoppers actually abandon carts
The reasons have not changed much, but the order of operations has. According to the latest Baymard data on shoppers with real purchase intent:
- 48 percent abandon because extra costs (shipping, taxes, fees) are too high or appear too late.
- 26 percent abandon because the store forces account creation.
- 22 percent abandon because the checkout is too long or complicated.
- 19 percent abandon because the payment method they wanted is not offered.
- 18 percent abandon because the site does not feel trustworthy with payment data.
Every one of those is a checkout design problem. None of them are solved by sending more recovery emails. Recovery is the safety net. Prevention is the playbook.
Show the real price before the checkout, not during it
Surprise shipping cost is the single biggest reason shoppers walk away. The fix is straightforward: surface the full landed cost as early as possible, and give shoppers a way to qualify for free shipping if it is on the table.
- Show shipping ranges on the product page using the shopper's location.
- Add a free shipping progress bar to the cart that updates in real time.
- Make taxes visible by the cart step, not the final payment step.
- If you charge a handling fee, label it clearly. Hidden line items break trust.
If shipping math is a constant headache, integrated rate shopping helps. UltraCart's built-in shipping engine is documented in the UltraShip overview and quotes live carrier rates inside checkout, so the number a shopper sees is the number you actually pay.
Cut the checkout to one page (and prove it on mobile)
Every additional checkout step costs roughly 10 percent of remaining shoppers. A four-step checkout loses around 35 percent of buyers to navigation alone, before any pricing or payment friction. Single-page checkout is the 2026 default.
Practical rules for the checkout page itself:
- One screen on desktop, one continuous scroll on mobile.
- No more than the fields you legally and operationally need. Most stores can drop two to four fields without losing anything.
- Address autocomplete on every address field.
- Inline validation, not error pages.
- A persistent order summary that does not collapse on mobile.
If your platform makes single-page checkout an add-on or a paid app, that is a sign the architecture is working against you. UltraCart bundles single-page checkout, mobile-first templates, and shipping math into the core platform, which removes the most common reason merchants tolerate slow checkouts: they were not sure how to fix it without a developer.
Stop forcing account creation
Mandatory account creation is the second-highest abandonment trigger and the easiest to fix. Guest checkout should be the default path. You can still offer account creation after the order is placed, and the conversion rate on a one-click "save my info" prompt on the receipt page is higher than gating checkout behind a signup.
The same principle applies to logins for returning customers. A buyer who cannot remember a password should not be punished. Send a one-tap magic link or let them check out as a guest and merge the order to their account behind the scenes.
Mobile checkout is the main event now
Mobile is where the math gets brutal. If your mobile checkout is 14 points worse than desktop, you are almost certainly losing six figures a year to fixable friction. The high-impact moves:
- Apple Pay and Google Pay as the first option, not buried below credit card. One-tap wallets are the single largest mobile conversion lever.
- Numeric keyboards for phone, ZIP, and card fields. The keyboard type is set in HTML, and most stores still get this wrong.
- Sticky pay button at the bottom of the viewport. A shopper should never have to scroll to find the button.
- Test on real devices. Mobile emulators in a browser miss real friction. Buy something from your own store on your own phone every month.
Offer the payment methods buyers actually use
Nineteen percent of late-stage abandonment is "you do not accept what I want to use." In 2026 that list is longer than credit cards and PayPal:
- Apple Pay, Google Pay, and other one-tap wallets.
- Buy now, pay later (Affirm, Klarna, Afterpay) for any order above your average ticket.
- ACH or pay-by-bank for higher-ticket B2B orders.
- PayPal where your audience expects it. Subscriber-heavy categories still see meaningful PayPal lift.
The platform fee math matters here too. If every additional payment processor costs you a separate monthly fee, you will under-invest. UltraCart's plugin-tax analysis walks through how those line items add up on competing platforms.
Use the cart itself as a conversion surface
The cart page is not a waiting room. It is the highest-intent moment in the funnel, and most stores treat it like a static summary. Two patterns that consistently lift order value without adding friction:
- Pre-checkout upsells on the cart, tightly relevant to what is already in the cart. Done well, this lifts AOV 8 to 15 percent without hurting conversion. The mechanics and pitfalls are covered in the pre-checkout upsell guide.
- Trust reinforcement directly under the pay button, not in the footer. Return policy, secure-checkout indicator, and shipping promise should all be visible without scrolling.
Recover the carts you could not save
Even a great checkout will not convert every shopper. Plan for a recovery sequence that catches the rest. The benchmarks worth chasing:
- SMS opens at 98 percent versus around 45 percent for email. SMS should be the first touch.
- The first hour is the hottest. Recovery sent within 60 minutes converts at roughly twice the rate of recoveries sent the next day.
- Three touches, then stop. Beyond touch three, recovery campaigns do more brand damage than revenue.
A standard recovery sequence in 2026 looks like this:
- +1 hour: SMS with a direct link back to the cart. No discount yet.
- +4 hours: Email with the cart contents and a clear "complete order" button.
- +24 hours: Email with a soft incentive (free shipping or 5 to 10 percent off) if margins allow.
- +72 hours: Final touch. After this, suppression is healthier than another email.
Built-in cart recovery beats third-party recovery tools on two dimensions that matter: the platform already knows the order data, and the recovery link drops the shopper directly back into the original cart with the same shipping and tax calculation. That second part fails constantly with third-party tools, and it is one of the silent reasons stores see lower recovery rates than the benchmarks suggest.
Measure what actually matters
Most stores measure cart abandonment as a single number. That is too coarse to act on. Track these instead:
- Cart-to-checkout rate, broken out by mobile and desktop. This isolates cart-page friction.
- Checkout-to-purchase rate, broken out by payment method. This isolates payment-step friction.
- Add-payment-to-purchase rate. The drop here almost always points to surprise costs or trust issues.
- Recovery rate by touch. Tells you when to stop sending.
If your reporting stack does not let you slice these by device, traffic source, and product category, that is a reporting problem worth solving before anything else. UltraCart merchants who export to BigQuery can build all four of these views in a couple of hours using the patterns in the BigQuery reporting guide.
Frequently asked questions
What is a good cart abandonment rate?
Anywhere between 60 and 80 percent is normal for eCommerce. The 2026 average is 70.22 percent. If your rate is above 80 percent, look at mobile checkout, surprise costs, and forced account creation first.
Does retargeting actually reduce cart abandonment?
Retargeting ads reduce abandonment modestly, around 5 to 10 percent for most stores, but the cost per recovered order is usually higher than direct recovery via email and SMS. Treat retargeting as a supplement, not a substitute.
Should I offer a discount in my recovery emails?
Not on the first touch. A discount on the first touch trains shoppers to abandon on purpose. Save the incentive for the second or third touch, and cap it at the smallest amount that closes the order.
How long does cart recovery stay effective?
Roughly 72 hours. Beyond that, conversion rates drop below 1 percent and unsubscribe rates climb. Recovery sequences longer than three touches almost always cost more than they earn.
Own the checkout, then prove what works with A/B tests
Every store has a slightly different audience, price point, and buying motion. A checkout that converts well for a $19 impulse product is not the same checkout that converts well for a $1,200 considered purchase, and neither is the same as a checkout for a subscription box or a quote-driven B2B order. The merchants who beat their category averages are the ones who can actually shape the checkout around how their customers buy, and then measure the difference.
That is the case for a fully customizable checkout. UltraCart's custom checkout gives merchants two paths to that control:
- StoreFronts visual builder. Drag-and-drop control over layout, fields, copy, trust elements, upsells, and the order in which steps appear. No developer required to move the pay button, reorder payment options, change the wording on the shipping section, or swap in a category-specific upsell.
- REST API checkout. For teams that want to build a fully bespoke front end on top of UltraCart's commerce engine, the same checkout is exposed as a documented REST API with SDKs in PHP, JavaScript, Python, Java, C#, and Ruby. Tax, shipping, payment, fraud, and order data all stay inside the platform, while the storefront becomes whatever the team wants to build.
The point in both cases is the same: the merchant is in control of the checkout, not the platform. Want to test a one-tap wallet above credit card on mobile but keep credit card on top for desktop? Want to add a "ships in 2 days" trust badge directly above the pay button for your highest-AOV category? Want to drop the company-name field for B2C buyers but keep it for B2B? All of that is a settings change, not a roadmap request.
A/B test the checkout itself, not just the marketing around it
Control without measurement is just opinion. The other half of catering a checkout to a real audience is testing changes against revenue, not against gut feel. UltraCart's StoreFronts Experiments framework runs A/B and multivariate tests directly inside the visual builder, with a few properties worth calling out:
- Server-side rendering of variations, so tests do not introduce the layout flicker that hurts conversion on slower mobile connections.
- Optimization on the metrics that matter, including conversion rate and revenue per visitor, not just clicks.
- Automatic traffic shifting toward the winning variation while the experiment is still running, so a clear winner stops costing you revenue mid-test.
- Automatic promotion and cleanup when a winner is confirmed, so the test does not quietly live on past its expiration date.
- Bot and internal-traffic filtering, so search crawlers and your own team do not pollute the results.
- Tied to UltraCart Analytics, so every experiment reads from the same revenue numbers as the rest of the reporting stack.
A reasonable testing cadence for most stores is one structural test (layout, field order, payment method order) and one copy test (button text, trust messaging, shipping promise) per month. After six months, the checkout you end up with looks nothing like the default, and the lift compounds: every win bakes into the baseline that the next test improves on.
This is the part that purely templated checkouts cannot match. If the platform owns the checkout, the merchant is limited to whatever experiments the platform allows. When the merchant owns the checkout, the only ceiling is what the data tells you to try next.
The faster path
Reducing cart abandonment in 2026 is not about adding another tool. It is about removing friction the shopper can feel, in the order they encounter it: price, page, account, payment, device. The stores winning right now are the ones that treat checkout as the product, not as the afterthought.
If you want to see how UltraCart's checkout, shipping, payment, and recovery tools fit together as one platform, take a look at pricing or book a walkthrough. We are happy to show the math on what a tighter checkout is worth for your specific store.